Single Cylinder Four Stroke Diesel- Computerized
Description
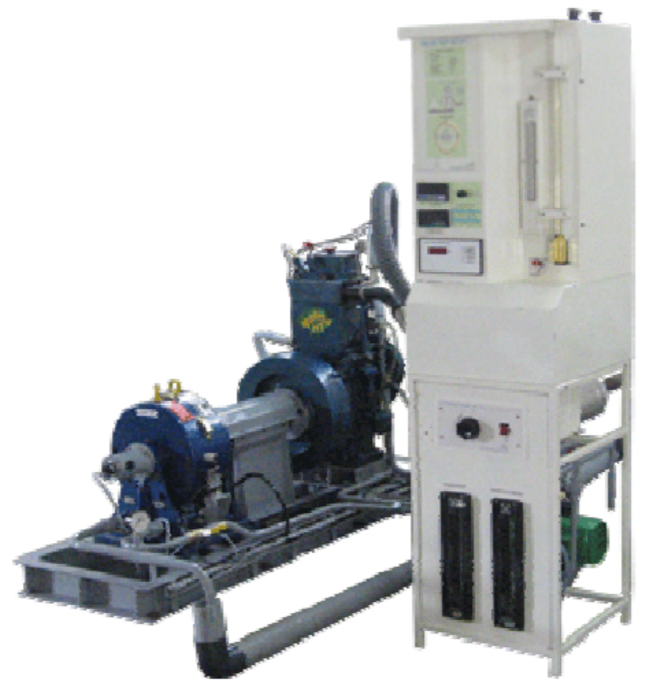
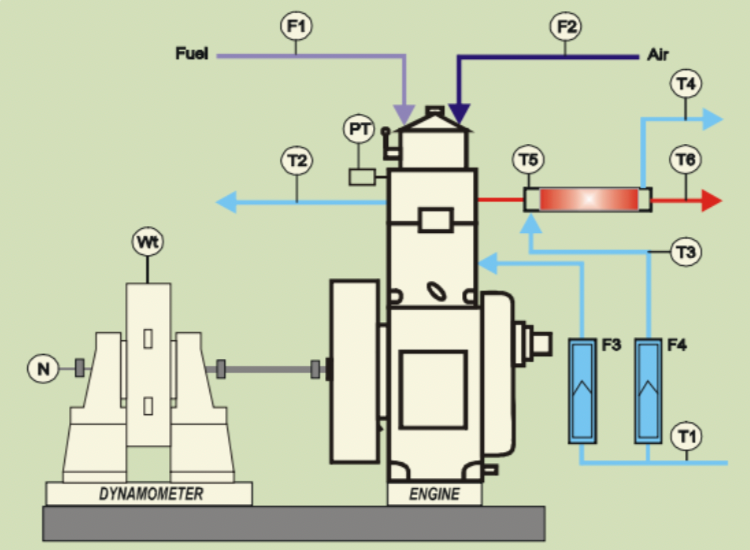
The setup consists of single cylinder, four stroke, Diesel engine connected to eddy current type dynamometer for loading. It is provided with necessary instruments for combustion pressure and crank‐angle measurements. These signals are interfaced to computer through engine indicator for Pθ−PV diagrams. Provision is also made for interfacing airflow, fuel flow, temperatures and load measurement. The set up has stand‐alone panel box consisting of air box, fuel tank, manometer, fuel measuring unit, transmitters for air and fuel flow measurements, process indicator and engine indicator. Rotameters are provided for cooling water and calorimeter water flow measurement. The setup enables study of engine performance for brake power, indicated power, frictional power, BMEP, IMEP, brake thermal efficiency, indicated thermal efficiency, Mechanical efficiency, volumetric efficiency, specific fuel consumption, A/F ratio and heat balance. Labview based Engine Performance Analysis software package “Enginesoft” is provided for on line performance evaluation. A computerized Diesel injection pressure measurement is optionally provided.
Features
• IP, IMEP, FP indication
• Online measurements and performance analysis
• PΘ‐PV plots, performance plots and tabulated results
• Data logging, editing, printing and export
• Configurable graphs
• Combustion analysis
• Valve timing diagram study
Range of Experiments
• Study of engine performance (Manual mode)
• Study of engine performance (Computerised mode)
• Study of pressure volume plot and indicated power
• Study of valve timing diagram
Software
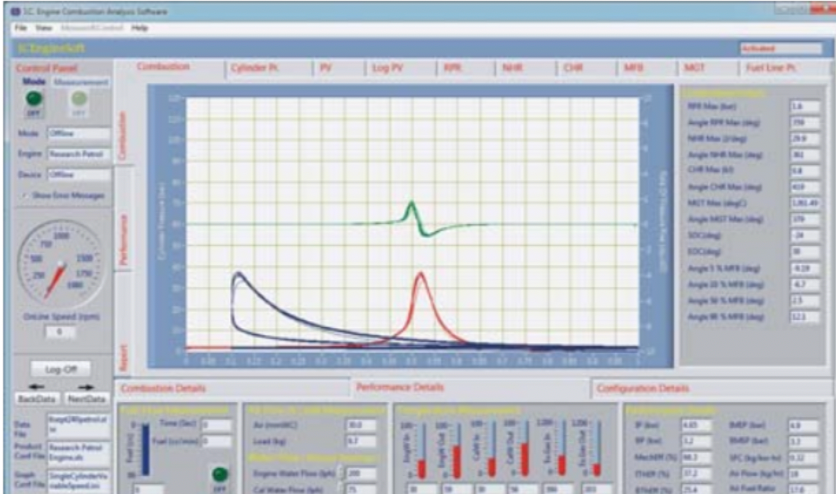
EngineSoft is Labview based software package developed by Apex Innovations Pvt. Ltd. for engine performance monitoring system. EngineSoft can serve most of the engine testing application needs including monitoring, reporting, data entry, data logging. The software evaluates power, efficiencies, fuel consumption and heat release. It is configurable as per engine set up. Various graphs are obtained at different operating condition. While on line testing of the engine in RUN mode necessary signals are scanned, stored and presented in graph. Stored data file is accessed to view the data graphical and tabular formats. The results and graphs can be printed. The data in excel format can be used for further analysis.
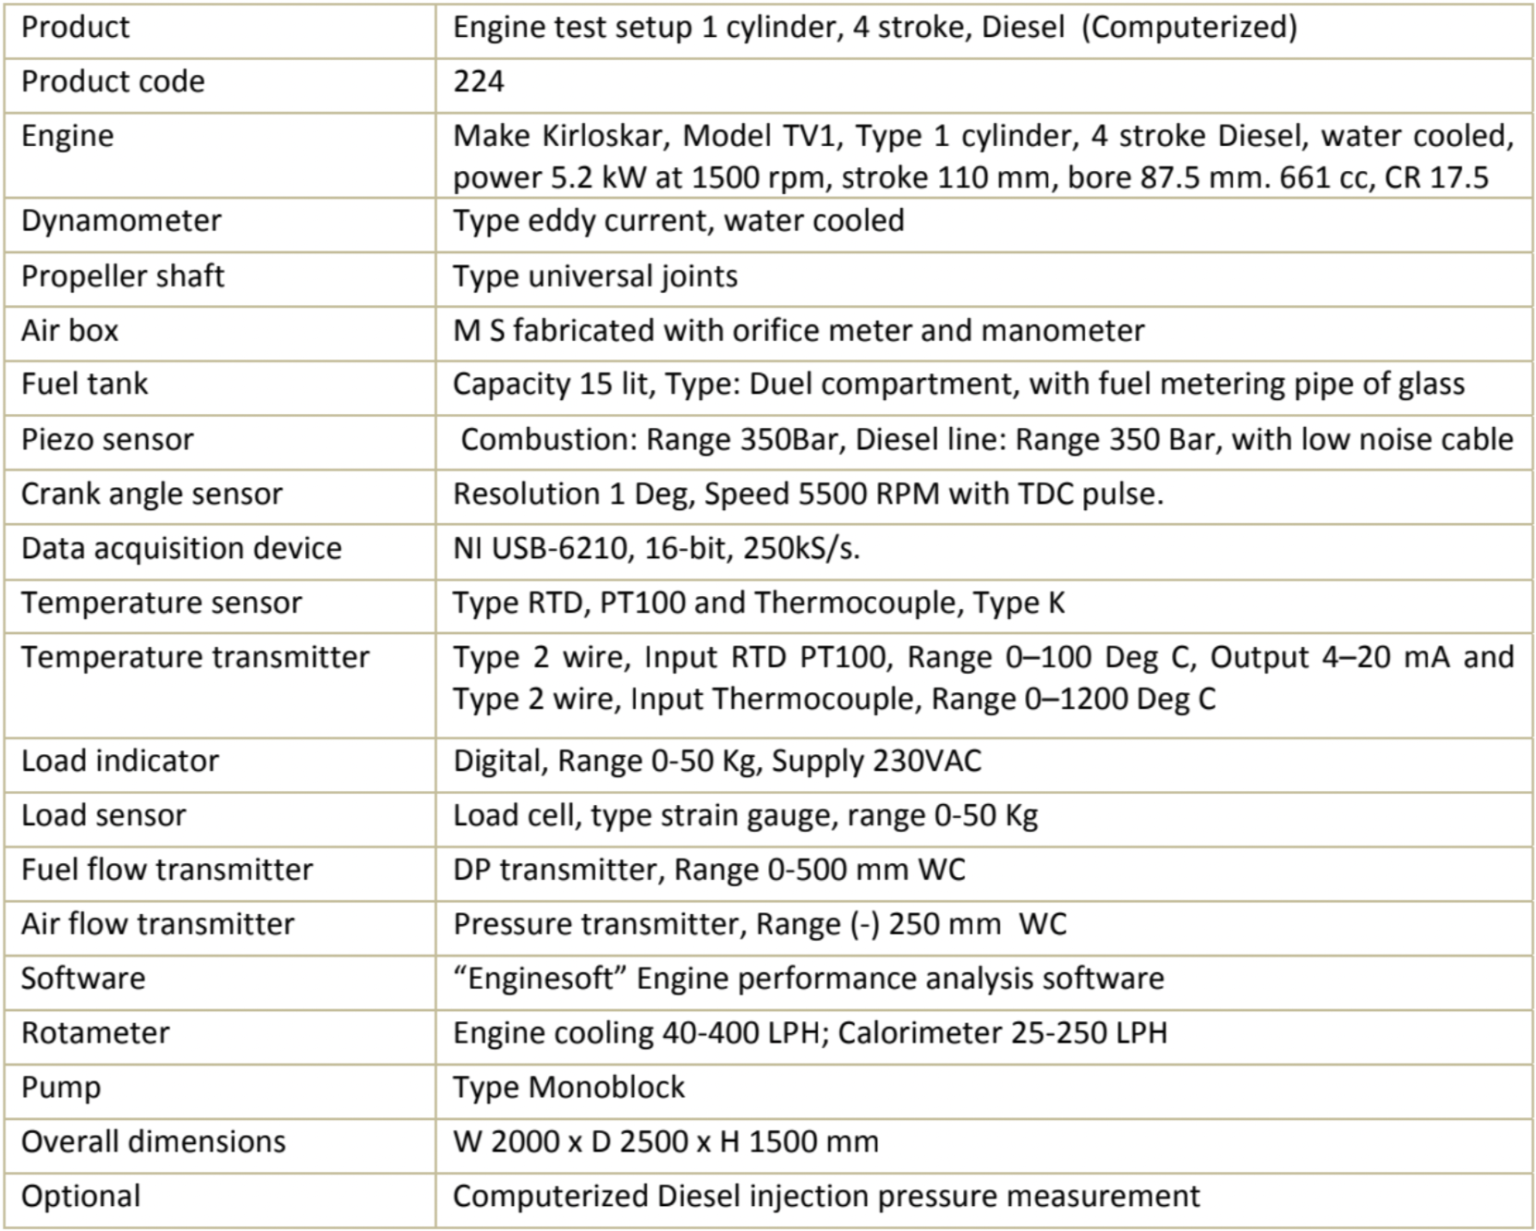
Product Specifications